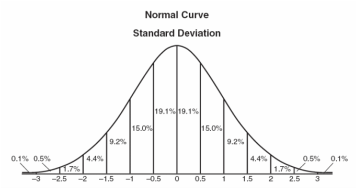
Normal Distribution: the function that represents the distribution of many random variables as a symmetrical bell-shaped graph.
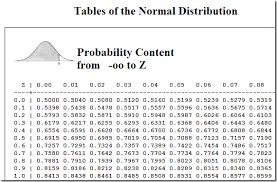
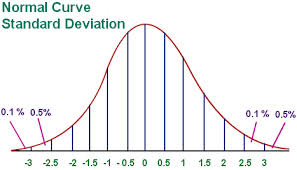
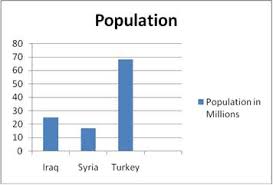
Normal Curve: The standard normal curve is the normal curve with a mean of zero and a standard deviation of one. Standard Normal Distribution: is a normal distribution with a mean of 0 and a standard deviation of 1.Areas under this table can be found using a standard normal table. Z Score: is a statistical measurement of a score's relationship to the mean in a group of scores. A Z score of 0 means the score is the same as the mean. Population: is a group of phenomena that have something in common. Sample: a selection taken from a larger group (the "population") so that you can examine it to find out something about the larger group. Areas Under a Normal Curve: a symmetrical bell-shaped curve representing the probability density function of a normal distribution.The area of a vertical section of the curve represents the probability that the random variable lies between the values which delimit the section. |
|
